Overview
This tutorial describes how to get started using the Ignition Common profiler to measure and visualize run-time performance of your software.
The ignition::common::Profiler provides a common interface that can allow for multiple underlying profiler implementations. Currently, the only available implementation is Remotery.
The goal of the profiler is to provide introspection and analysis when enabled at compile time, but to introduce no overhead when it is disabled at compile-time.
To control if the profiler is enabled, set the IGN_PROFILER_ENABLE flag using cmake on the targets or sources that you are interested in (described below).
Enabling the Profiler
On custom example
In order to use the profiler, inspection points must be added to the source code, and the application or library must be linked to the ignition-common::profiler component.
To start, download the profiler.cc example.
The relevant corresponding C++ would be as follows:
Update your CMakeLists.txt to the following. Note that the profiler must be enabled at compile time in order to function.
Run cmake and build the example
Then execute the example and the profiler visualization:
From terminal 1:
From terminal 2, open the visualizer using one of the following commands
On Ignition library
If you want to use profiler on any other ignition library, enable the profiler at compile time with ENABLE_PROFILER cmake argument.
When compiling with CMake:
When compiling with colcon:
Run your Ignition library then open the profiler browser using:
If the profiler is run successfully, you should see output in a browser. Similar to this
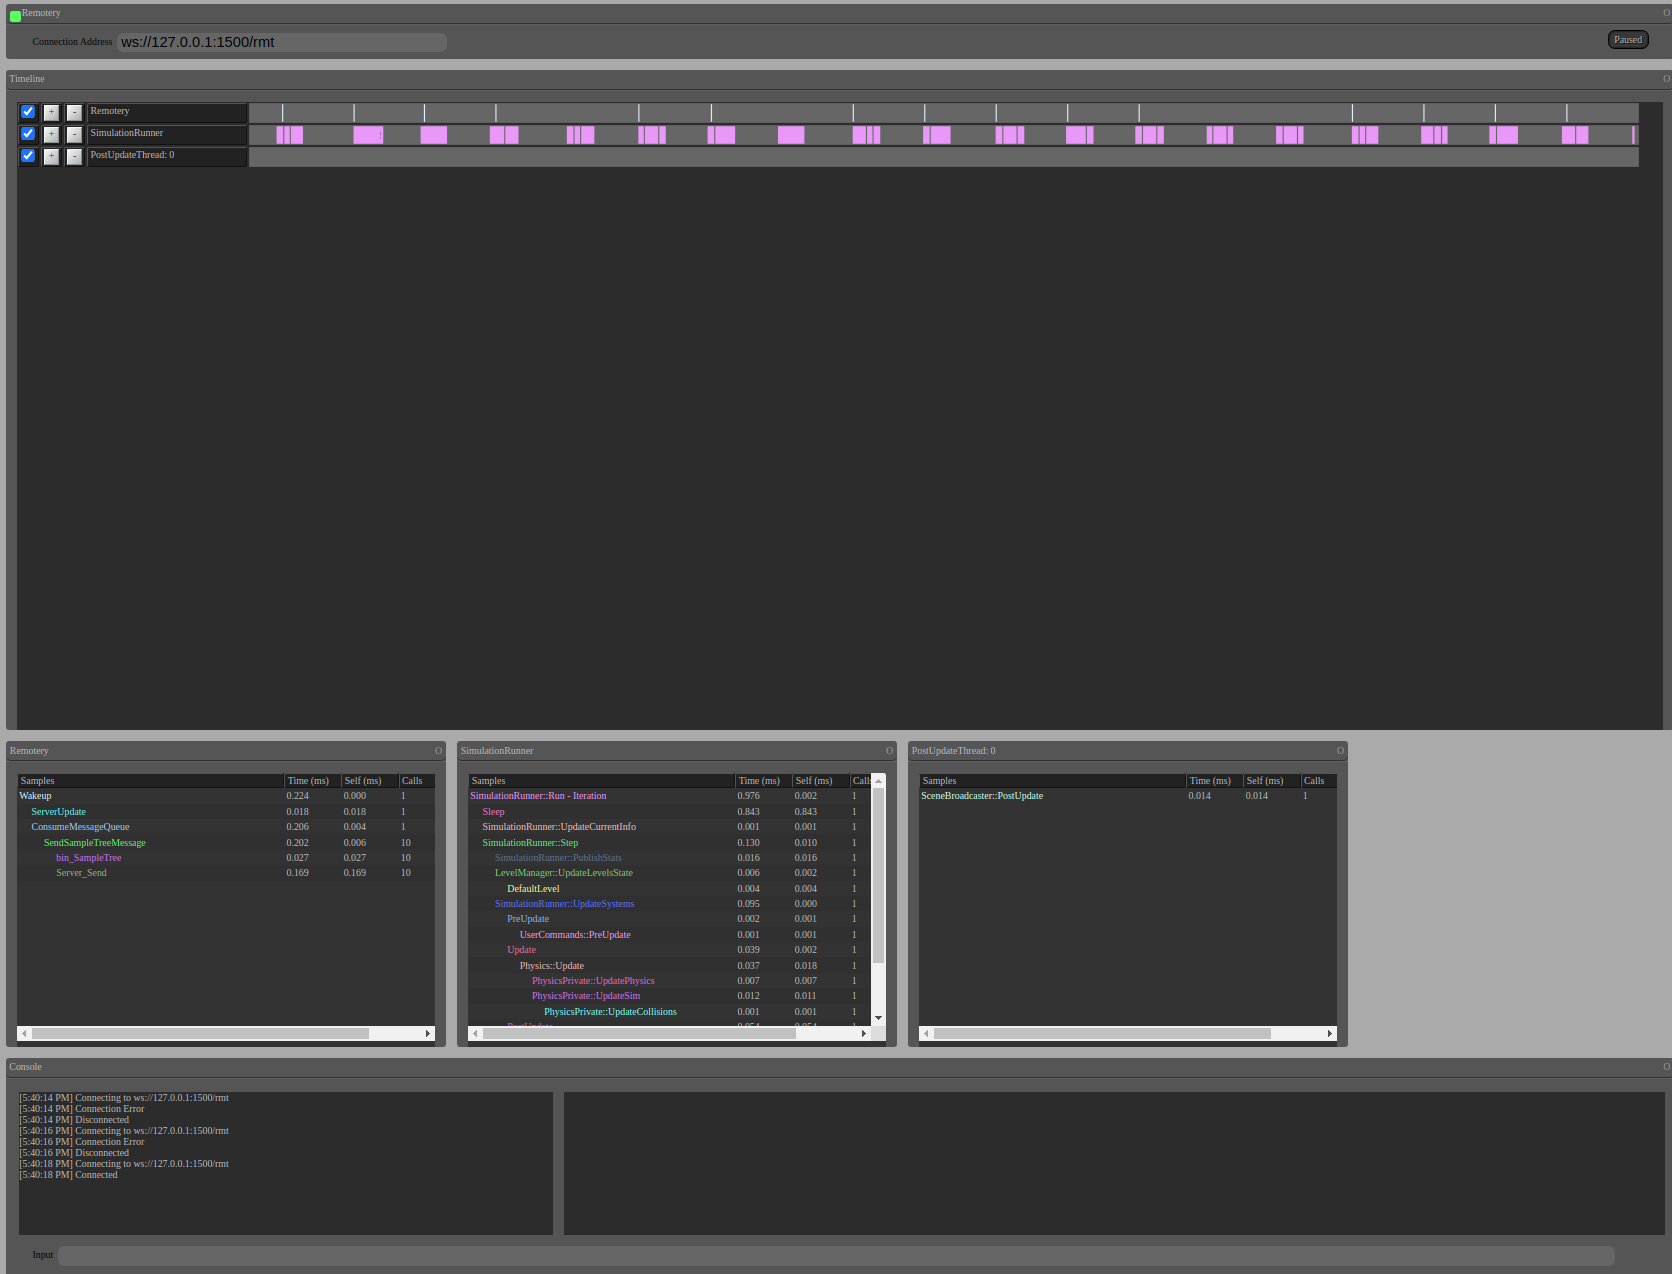
Troubleshoot the web viewer
If you see connection error, there are a couple of things to double check
- Was the profiler enabled when the project you're trying to run was compiled? Note that this isn't the case if you installed Ignition libraries from binaries, for example. You need to compile the project from source with the
ENABLE_PROFILERvariable set. Are you using the correct port number in the upper left corner
Connection Addresss: ws://127.0.0.1:1500/rmt? Runningign gazebo -v 4will show the port number in use near the top of the outputted text. The port number will be printed out if the profiler is enabled.```{.sh} [Dbg] [RemoteryProfilerImpl.cc:187] Starting ign-common profiler impl: Remotery (port: 1500) ```
- Are you running the program in a separate terminal? The profiler only establishes connection if there is a program running and being actively profiled.
- If you want to use a different port, configure the environment variable
RMT_PORTby running the following in terminal, and update the web viewer port in your browser accordingly (see 2 above) ```{.sh} export RMT_PORT=1500 ```
Using the Profiler
The profiler is used through a series of macros.
The two primary ways of profiling a section of code are to either use a matched pair of IGN_PROFILE_BEGIN and IGN_PROFILE_END macros, or to use a single RAII-style macro IGN_PROFILE. The RAII style will stop measuring once the scope that the macro was invoked in is left.
Using begin/end:
Using RAII-style:
Additionally, each thread can be given a name for easy reference in the UI:
Configuring the Profiler
Specific profiler implementations may have further configuration options available.
Configuring Remotery
Remotery can additionally be configured via environment variables. Most users should not need to change these for their applications.
RMT_PORT: Port to listen for incoming connections on.RMT_QUEUE_SIZE: Size of the internal message queuesRMT_MSGS_PER_UPDATE: Upper limit on messages consumed per loopRMT_SLEEP_BETWEEN_UPDATES: Controls profile server update rate.
These directly set the corresponding parameters in the rmtSettings structure. For more information, consult the Remotery source